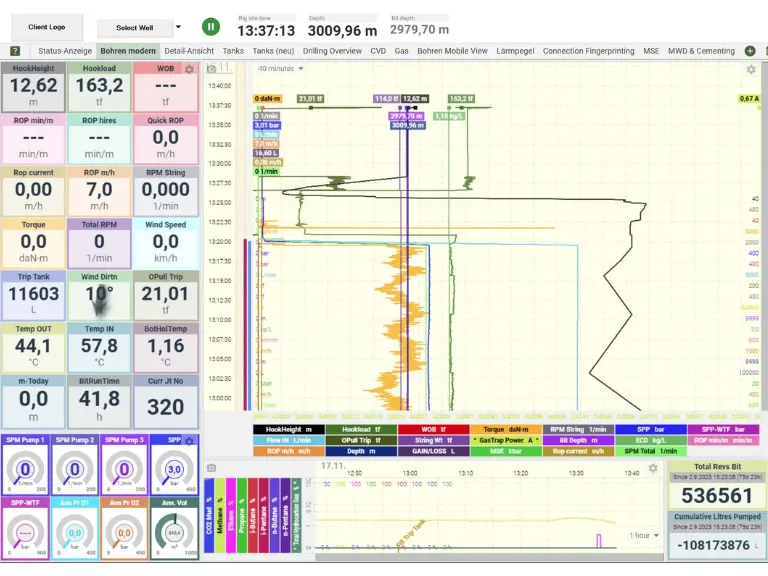
GEOWellVIS™ is our real-time drilling data visualization solution that displays all drilling and surface logging parameters including WOB, WOH, SPM, torque, and gas readings. Data can be displayed as numerical values, curves, tachometers, volumes, traffic lights, counters, or text. The platform uses modern browsers (Chrome, Firefox, Edge) and is completely operating system independent, working seamlessly on desktop computers, tablets, and smartphones. The compilation of individual modules is fully customizable by the user, allowing personalized dashboard configurations. At any time, users can export data to Excel, LAS 3.0, or CSV formats. Parameter compositions and resolutions can be saved as templates for quick access. Real-time visualization is available both on-site at the rig and remotely via secure internet connection, providing operational teams and management with instant access to critical drilling data.
Realtime Drilling Data Visualization
GEOWellVIS™ is our browser-based platform for real-time visualization of all drilling parameters including WOB, torque, and gas readings. The system works on any device and operating system with fully customizable dashboards. Data can be exported to Excel, LAS 3.0, or CSV at any time.